
Milestones: 27 Years of
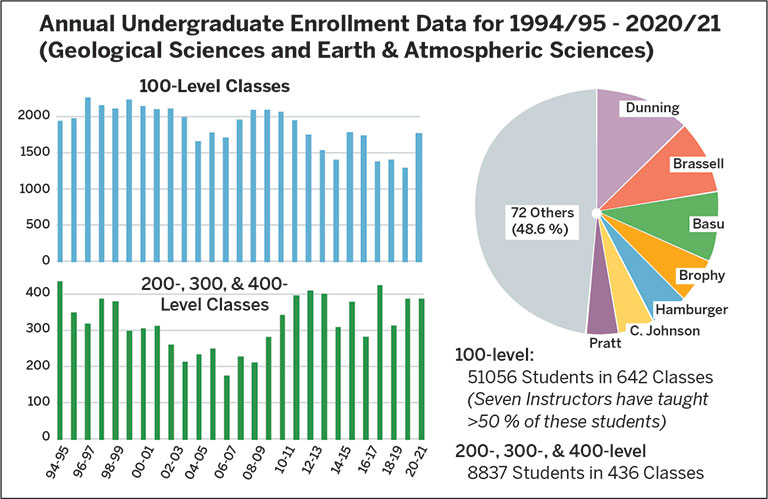
The histogram shows the annual enrollment over these years and the pie diagram reflects who taught these classes and students. Remarkably - or maybe it isn’t so surprising – seven members of the faculty have taught over half these students, more that the other 72 other faculty and students combined over these years. Three of the seven – Michael, Claudia and Simon – are still teaching!
The focus is on 100-level classes because the enrollment in these class is ~5 times that in all other UG classes combined. - Simon C. Brassell
Data for annual undergraduate enrollments (sum of fall, spring, and summer classes) in Geological Sciences and Earth and Atmospheric Sciences from fall 1994 through summer 2021.
Major Points:
- Total enrollments: 51,056 students in 642 100-level classes and 8,837 students in 463 200-, 300-, and 400-level classes; 59893 students in 1105 undergraduate classes.
- Total undergraduate enrollment = 85.2 % in 100-level classes, 14.8 % in 200-, 300-, and 400-level classes.
- Seven instructors (Dunning: 6,457; Brassell: 4,964; Basu: 4,732; Brophy: 3,036; Hamburger: 2,499; C. Johnson: 2,482; Pratt: 2,084) have taught classes that account for 51.4 % of 100-level enrollments, with 72 other instructors teaching the other 48.6 %.
- Eight instructors (Dunning: 6,504; Brassell: 5,139; Basu: 4,732; Brophy: 4,264; C. Johnson: 3,173; Hamburger: 2,623; Douglas: 2,548; Pratt: 2,332) have taught classes that account for 52.3 % of all undergraduate enrollments (100-, 200-, 300- and 400-level classes), with 85 other instructors teaching the other 47.7 %.
- 100-level trends: There were lower 100-level enrollments in 2004/05-2006/07 than in previous years and a decline from 2011/12 to 2014/15, rebounding in 2015/16, 2016/17 and 2020/21. Similar numbers of classes (range 21-24) were taught in each year, so the trend is not directly related to the number of courses offered.
- 200-, 300-, and 400-level trends: The irregular, gradual decrease in enrollments by almost 60 % (433 to 175) from 1994/95 to 2006/07 was steadfastly reversed to a total enrollment over 400 from 2007/08 to 2012/13. More recently, annual enrollments have oscillated between lower (~300) and higher (~400) cumulative values.
 The College of Arts